Measure twice, cut as many times as you like.
As promised, I am starting a series of blog posts on .Net performance and scalability tuning. I have been doing this in my current role at QSR International, and have been amazed at just how many possibilities I have found to improve the performance of the application. Each time I get to a point where I think I can’t get any more performance out of it, I find something else, or have another idea. Not all of these tips are specifically .Net related, many of them will be applicable to any programming language, but my focus for the past 7 years of my career has been specifically on .Net, so naturally, I will be focussing fairly heavily on that. These tips will also be fairly heavily “Rich Client” based as that's where I have spent most of my career, however some of these tips will also apply to any .Net code running anywhere.
My first tip is simple. Measure what you are trying to tune. You’ll probably see many bugs in your bug tracking system (you do use a bug tracking system right? If not I suggest you stop reading this article right now, and go find yourself a bug tracking system ASAP), that read “Application is slow when I do XYZ” or “Opening form foo takes forever”. The first step is to get this quantified. Exactly how many seconds does it take to do ‘X’, where ‘X’ is repeatable. Testers will probably have a set of test data, and you need to get your hands on this. Often performance issues surface because the data is structured in a specific way, and if you have differently structured data you may well not spot the problem (have a free “Works on My Machine Certification”). Once your testers have measured it, then you might want to start a discussion around what is acceptable, what you should be aiming for in the tuning etc….
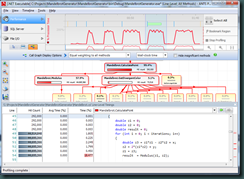
Now I said “Measure twice”, well, after the testers have got some basic timings that you can use for comparisons at the completion of your tuning, then it’s your turn to measure. There are a number of tools that will analyse your code and assist in highlighting the areas that require the most attention. Visual Studio comes with a performance wizard under the “Analyze” menu. This is a reasonably good starting point, but personally I prefer tools with a nicer UI. My current favourite at the moment is “ANTS Performance Profiler” from redgate, but there are others out there (Feel free to leave a comment if you have another preference).
For me the visualizations provided by ANTS Performance Profiler allow me to very quickly and effectively focus my attention. Without this knowledge, you can spend a lot of time optimizing bits of code that are called so infrequently that even optimized won’t make any noticeable difference to the overall performance. Once you’ve picked a measuring tool, learn it and master it. I usually like to take a series of measurements as I go. As you improve the performance of one problematic area, others will start to rear their ugly heads. Also a series of good visualizations can make for some good discussions with management if they want to know how you’re going. it is also a good education tool for other developers in your team. You can show them exactly why you should, or shouldn’t do particular things.
Now that you have measured twice, unlike carpentry where the proverb “Measure twice, cut once” comes from, as coders, we can cut as many times as we need. Assuming you are using a decent source control system (and by the way, if you’re not, stop reading this article and go get yourself one NOW), you can confidently try different options to your hearts content. Keep in mind that sometimes release code behaves slightly differently to debug code, and as such, your final sign off should come from the testers testing on the release version of your build.
Stay tuned, much more to come.


